
Digital Asset Scenario Tool
- No investment advice
- No return promises
- Historical data, not a forecast
Create a hypothetical allocation
Assets & allocationUp to 20 assets. Percentages apply to both the starting amount and every recurring contribution.
Contribution & costs
Time period & strategy
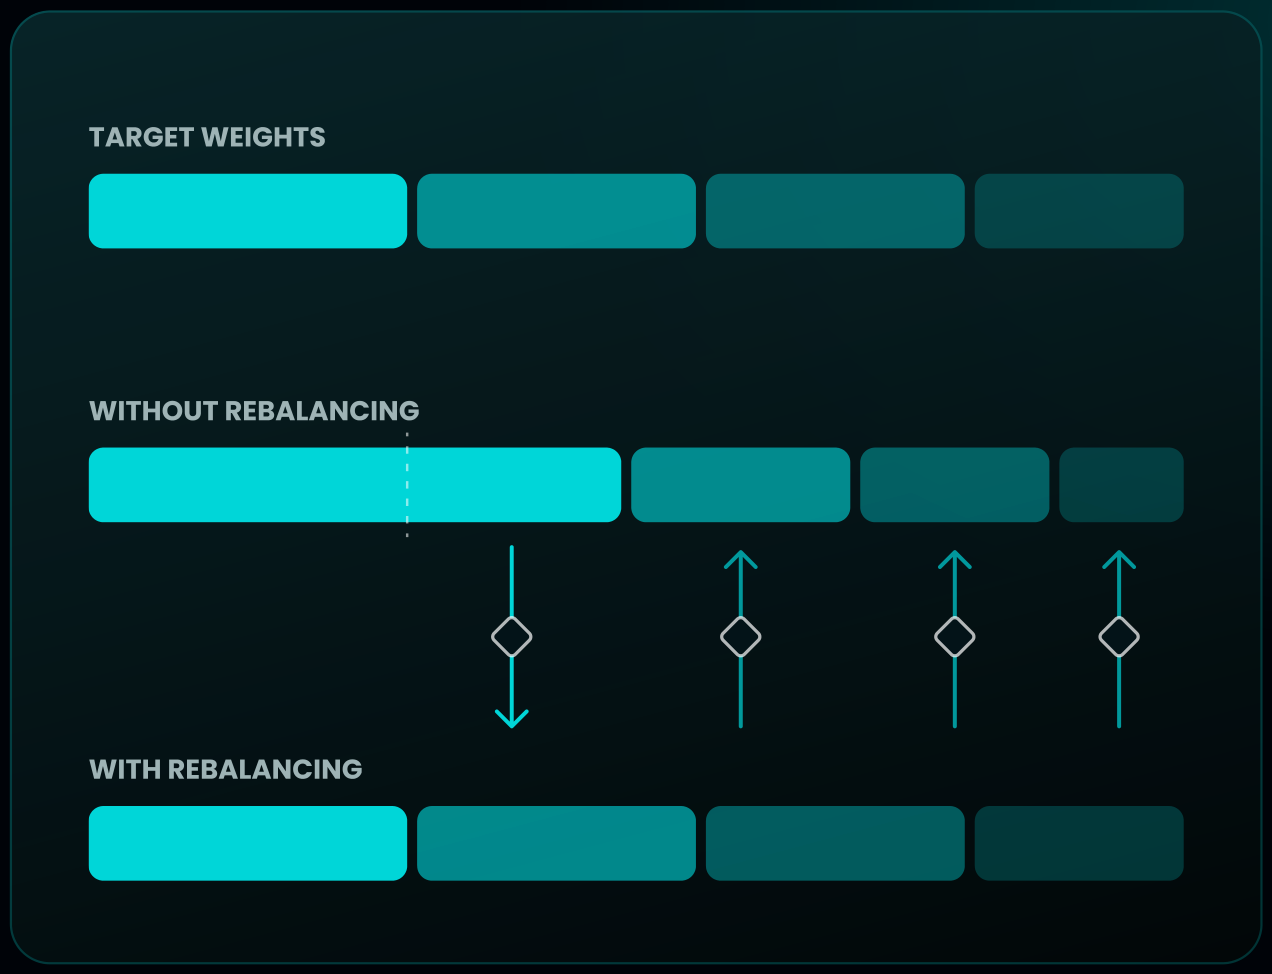
Rebalancing sells overweight assets and buys underweight ones to restore the target allocation. Trades incur the estimated trading cost above.
Each asset gets its own synthetic price path (different phase, drift, and noise) under the scenario you pick, so different allocations still produce different results. This is not a forecast or a model of any real asset's behavior.
Compare & risk settings
Alternate allocation (optional)Same assets, contribution schedule, purchase timing, estimated costs, and rebalancing as the primary allocation above — only the target weights differ, so you can isolate the effect of allocation alone.
Scenario results
These observations describe the selected historical period only. They do not indicate what may happen in the future.
CAGR, volatility, Sharpe, Sortino, and Calmar are calculated on a hypothetical $1,000 lump sum with no further contributions (the "strategy index"), so your contribution schedule doesn't distort them. For the money-weighted return of this exact contribution plan, see XIRR above.
Unlock the full analysis
Per-asset breakdown, benchmark comparison, risk analysis, annual returns, and a downloadable scenario report — enter your details to access.
Get the detailed asset breakdown, benchmark comparison, risk analysis, annual returns, drawdown history, and downloadable scenario report.
Per-asset breakdown
Actual allocation at end of period
Compares the target weights to how the hypothetical allocation actually drifted (or was restored, if rebalancing was on).
Benchmark comparison
Same contribution schedule, timing, and estimated costs — applied 100% to a single asset instead of the blended hypothetical allocation.
Alternate allocation comparison
Same contribution schedule, purchase timing, estimated costs, and rebalancing as the primary allocation — only the target weights differ.
Annual returns
Calendar-year returns of the strategy index (hypothetical lump sum, no ongoing contributions) — isolates market performance from your contribution schedule. * = partial year.
Drawdown history
The largest peak-to-trough declines in the strategy index during this period, ranked by depth.
Rolling 12-month returns
Every possible 12-month holding period inside your selected range, on the strategy index.
Monthly return distribution
How often the strategy index posted each range of monthly returns, bucketed in 5% increments. Green = positive month, red = negative month.
Correlation matrix
Monthly return correlation between the assets in the hypothetical allocation over this period. 1.00 = move together perfectly, −1.00 = move opposite, 0 = no linear relationship. Historical only — correlations shift over time and tend to rise in market downturns, exactly when diversification matters most.
Month-by-month detail
Want to discuss the scenario?
Your results are hypothetical and based on historical market data. If you'd like to discuss the methodology, assumptions, or what the scenario shows, our team can walk you through the analysis.
For educational purposes only. This tool uses historical market data to illustrate hypothetical scenarios. It does not provide investment, tax, or financial advice, and no result should be interpreted as a recommendation or prediction. Past performance does not indicate future results. Digital assets involve substantial risk, including possible loss of principal.
- Historical market data mode uses actual past market prices from a public third-party API (CoinGecko). If that data can't be retrieved, this tool shows an error rather than substituting synthetic numbers. On CoinGecko's free tier, historical data only covers the past 365 days; older start dates require Hypothetical model mode.
- Hypothetical model mode uses entirely simplified, synthetic prices to demonstrate mechanics — not real market data, and not a forecast or expected return.
- Rebalancing, fees, and cost-basis tracking are modeled with simplified, monthly-granularity assumptions — not a substitute for actual brokerage or exchange accounting.
- XIRR, maximum drawdown, and best/worst month are calculated on the modeled data above and are historical, not predictive.
- Any tax figure shown is a rough illustration at a flat rate you choose — not tax advice, and not specific to any jurisdiction.
- Benchmark comparisons are hypothetical and assume the same contribution schedule applied entirely to one asset.
- CAGR, annualized volatility, Sharpe ratio, Sortino ratio, and Calmar ratio are calculated on a hypothetical $1,000 lump sum held with no further contributions (the "strategy index") — this isolates market performance from your contribution schedule but means these figures are not the money-weighted return an investor following this exact contribution plan would have experienced. XIRR is the money-weighted figure.
- Sharpe and Sortino ratios depend entirely on the risk-free rate you enter; changing that assumption changes the ratio. These are simplified, monthly-data calculations, not the exact methodology any specific index provider uses.
- The correlation matrix is historical and not predictive. Correlations between assets change over time and often rise sharply during market downturns, reducing the diversification benefit exactly when it would matter most.
- The drawdown history, rolling returns, and monthly return distribution are all based on the strategy index described above, not your actual dollar-cost-averaged cash flows.
- The alternate allocation comparison uses the same assets, contribution schedule, purchase timing, fees, and rebalancing as your main portfolio — only the target weights differ. It is not a suggestion that either allocation is better.
- Inflation adjustment uses the actual historical U.S. CPI inflation rate averaged over your selected period, sourced from the World Bank public API (series FP.CPI.TOTL.ZG). If the API is unavailable, you can enter your own estimate. The rate is applied uniformly across the period and is an approximation — actual purchasing-power impact varies by individual and spending category.
- The risk-free rate used for Sharpe and Sortino ratios is pre-filled from the U.S. Treasury Fiscal Data API (3-month T-bill average rate). You can override it at any time. This is an approximation; actual risk-free rates varied month-to-month over the selected period.
- State tax estimates are based on top marginal state income tax rates and are illustrative only. Actual tax liability depends on holding period (short- vs. long-term), total income, filing status, deductions, local taxes, and year-by-year law changes. This is not tax advice — consult a qualified tax professional.
- Kenson Investments is not a registered investment adviser and does not provide investment advice.
Discuss the analysis
Our team can walk you through the methodology, assumptions, and what the historical scenario results mean.
What Is A Crypto
Backtesting Tool?
A crypto backtesting tool, sometimes called a crypto portfolio backtester, takes a hypothetical mix of digital assets and shows how that mix would have performed over a past period. Kenson’s Digital Asset Scenario Tool does this for up to 20 assets at once. You set the allocation, the contribution schedule and the costs, and the tool reports the historical outcome along with its volatility and drawdowns.
Backtesting is a way to study history. It shows how an allocation behaved, including the uncomfortable months, and it compares that behavior against holding a single asset. It does not predict what the same allocation will do next, and nothing in the tool is investment advice.
How To Use The Crypto Backtesting Tool

Create a hypothetical allocation.
Add up to 20 assets and assign each a percentage, or start from a preset such as BTC Core, Diversified, L2 Focus or AI & Compute.

Set contributions and costs.
Enter a starting amount, a monthly contribution, an optional annual increase, and an estimated fee per trade.

Choose purchase timing.
The 1st, the 15th, the last day of the month, or the monthly average price.

Pick the period and rebalancing.
Select start and end months, then rebalance never, monthly, quarterly or annually.

Select the price source.
Historical market data, or a hypothetical model for demonstration.

Analyze the scenario.
Enter your details to open the full analysis.
What The Scenario
Results Include
The headline results cover total contributed, ending value, gain or loss, simple return, annualized return (XIRR), maximum drawdown, and the best and worst months. A chart plots scenario value against total contributions.
The full analysis goes further:

Per-asset breakdown.
Units held, average cost, value and gain or loss for each asset.

Benchmark comparison.
The same schedule applied 100% to each single asset.

Annual returns.
Calendar-year results for the portfolio and each asset.

Drawdown history.
The largest peak-to-trough declines, with recovery dates.

Rolling 12-month returns.
Best, worst and average 12-month windows.

Correlation matrix.
How closely the assets moved together.
Reading The Risk
Metrics
The tool reports several measures used in portfolio research. Here is what each one means.

The risk-free rate is pre-filled from U.S. Treasury data, and you can change it. An optional setting adjusts results for U.S. inflation.
XIRR
is a money-weighted annual return. It accounts for the size and timing of every contribution.
CAGR
is the annual growth rate of a single lump sum held for the whole period.
Maximum drawdown
is the largest fall from a peak to the following low.
Annualized volatility
measures how widely monthly returns varied.
Sharpe ratio
compares return above a risk-free rate with total volatility.
Sortino ratio
is similar but counts only downside volatility.
Calmar ratio
divides CAGR by maximum drawdown.
Why Rebalancing And Fees
Matter In A Backtest
Two allocations with the same assets can produce different results because of rebalancing. Without it, the best-performing asset grows into a larger share of the portfolio, which raises concentration. With it, the tool sells what has grown and buys what has lagged to restore the target weights. Each of those trades carries a cost.
The scenario tool applies your fee estimate to every buy, sell and rebalancing trade, so you can see how costs accumulate. You can also switch on an alternate allocation, which runs a second set of weights for the same assets and plots it beside the first.
The Limits Of
Historical
Crypto Returns

Historical market data in this tool covers the most recent 12 months. Earlier start dates use the hypothetical model, which is synthetic and labeled as such. The simulation runs on monthly data, so it is simpler than real exchange accounting. Tax figures use one flat rate that you choose and are not tax advice.

Correlations also change. Assets that moved independently in calm markets have often fallen together in downturns, which is when diversification matters most.

Educational use only. The information and examples on this page are provided to help explain digital asset concepts and historical scenarios. They are not personalized financial guidance or a recommendation to buy, sell or hold any asset.



Frequently Asked Questions
What is crypto backtesting?
Crypto backtesting applies a chosen allocation and contribution schedule to past prices to see how it would have performed. It describes history and is not a forecast.
How many assets can I include in a scenario?
Up to 20 assets. You can assign each one a percentage yourself or start from a preset such as BTC Core, Diversified, L2 Focus or AI & Compute.
What is the difference between XIRR and CAGR?
XIRR is a money-weighted annual return that accounts for the size and timing of every contribution. CAGR is the annual growth rate of a single lump sum held for the whole period.
Does the scenario tool include trading fees?
Yes. You enter an estimated fee per trade, and the tool applies it to every buy, sell and rebalancing trade so you can see how costs accumulate.
How far back does the historical data go?
Historical market data covers the most recent 12 months. Earlier start dates use the hypothetical model, which is synthetic and labeled as such.
Can I download my scenario results?
Yes. You can download the scenario as a PDF report or export the month-by-month data as a CSV file.
Is the scenario tool investment advice?
No. The tool describes how a hypothetical allocation behaved in the past. It does not predict what the same allocation will do next, and nothing in the tool is investment advice.

Compliance Disclaimer.
This tool and the content on this page use historical market data to illustrate hypothetical scenarios.
Results are hypothetical, were calculated with the benefit of hindsight, and do not represent actual trading or any actual account.
The risk-free rate used for Sharpe and Sortino ratios is pre-filled with the average interest rate on U.S. Treasury bills from the U.S. Treasury Fiscal Data API. You can override it at any time. This is an approximation; actual risk-free rates varied month to month over the selected period.