








Bitcoin briefly crossed $84,000 on October 14, 2026, drawing attention to the resilience of its latest recovery. However, the rebound came amid substantial outflows from exchange-traded funds (ETFs), raising questions about the strength of underlying demand. Barron’s reported that Bitcoin’s price resilience did not necessarily indicate a lasting recovery. The cryptocurrency was trading relatively flat near $83,398 at the time of its report.
This disconnect highlights an important principle when navigating the digital asset market: a price increase alone cannot establish a sustained trend. Market participants need to examine trading volume, fund flows, liquidity, and volatility together. These indicators provide a broader view of market conditions and help explain why prices can rise even when some sources of demand weaken.
Why One Price Milestone Is Not Enough
A price milestone captures a moment, not the full state of a market. Bitcoin can rise because of short-term buying pressure, changes in market sentiment, or reduced selling activity. None of these factors automatically confirms that demand will remain strong.
For example, a rebound above $84,000 may attract attention after a period of selling. Yet, if buying activity quickly fades, the price may struggle to maintain that level. Conversely, a market that advances gradually alongside broader participation may show a different pattern.
This distinction matters when conducting investment analysis. A single day’s movement provides limited evidence about what may happen next. Comparing price action across several days and weeks can reveal whether a rebound is developing into a more sustained trend.
Market participants should therefore separate observable facts from assumptions. Bitcoin crossed a notable price level, but that event alone does not establish the direction of its next move.
ETF Outflows and the Demand Question
ETF flows provide one useful measure of demand for Bitcoin exposure through listed investment products. Net inflows indicate that more capital entered these products than left them during a given period. Net outflows indicate the opposite.
CoinDesk reported that US-listed spot Bitcoin ETFs recorded approximately $681 million in net outflows during the week preceding October 12, their largest weekly withdrawal since June. Bitcoin nevertheless rebounded toward $84,000 during that period. <Cite refs={[“turn341584search0”]}/>
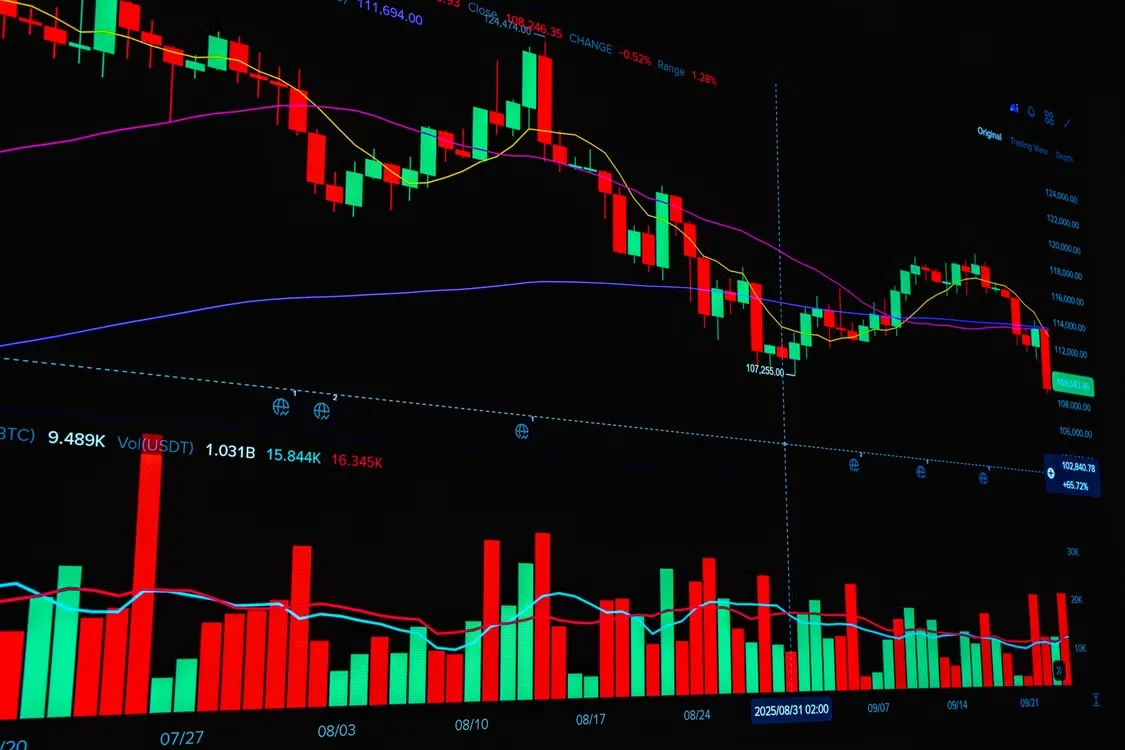
This divergence deserves attention, but it does not tell the whole story. ETF flows represent activity within specific products. They do not capture every Bitcoin transaction or all sources of buying and selling across the wider market.
Outflows can coexist with rising prices when other buyers absorb the available supply. They can also reflect portfolio adjustments, changing liquidity needs, or shifts in short-term sentiment.
The practical takeaway is to compare daily ETF figures with weekly and monthly trends. A single outflow does not establish a long-term shift. Persistent withdrawals, especially alongside weakening prices and trading activity, may provide a different signal.
Trading Volume: Measuring Participation
Trading volume measures how much of an asset changes hands during a specified period. It helps place a price movement in context.
A sharp price increase accompanied by expanding volume suggests greater trading participation. However, high volume does not automatically indicate strong buying demand. Every completed trade has a buyer and a seller, so volume must be interpreted alongside price direction and order flow.
Consider two hypothetical scenarios:
- Bitcoin rises 3% while trading volume increases significantly. The move attracts broader participation, although further evidence is still needed to assess its durability.
- Bitcoin rises 3% while volume declines. The price advances, but participation appears weaker than before.
Neither scenario guarantees a particular outcome. The comparison simply helps identify questions that deserve further examination.
Reviewing volume across multiple timeframes also reduces the risk of overreacting to isolated spikes. A brief surge may reflect a single event, while persistent activity can provide more context about the market’s direction.
Market Liquidity and Price Stability
Liquidity describes how easily an asset can be bought or sold without causing a substantial price change. It affects transaction execution and the potential cost of entering or exiting a position.
When liquidity is deep, larger orders can generally be absorbed with less price disruption. When liquidity thins, even relatively modest orders may move prices more sharply. This can increase uncertainty during periods of heightened market activity.
For those examining crypto asset management, liquidity deserves attention alongside headline prices. Two markets displaying similar price changes may have very different execution conditions.
Useful indicators include bid-ask spreads, order-book depth, and the price impact of larger orders. Wider spreads or declining depth may indicate that execution has become more difficult.

Liquidity can also change quickly. Market participants should avoid assuming that conditions observed during a quiet session will persist during a sudden sell-off or price surge.
Volatility and the Difference Between a Rebound and Recovery
Volatility measures the degree to which prices fluctuate over time. Large and frequent price changes can indicate uncertainty, shifting expectations, or rapidly changing market conditions.
A short-term rebound describes a price increase following a decline. A sustained recovery requires more evidence, including continued demand, resilient trading activity, and price strength across longer observation periods.
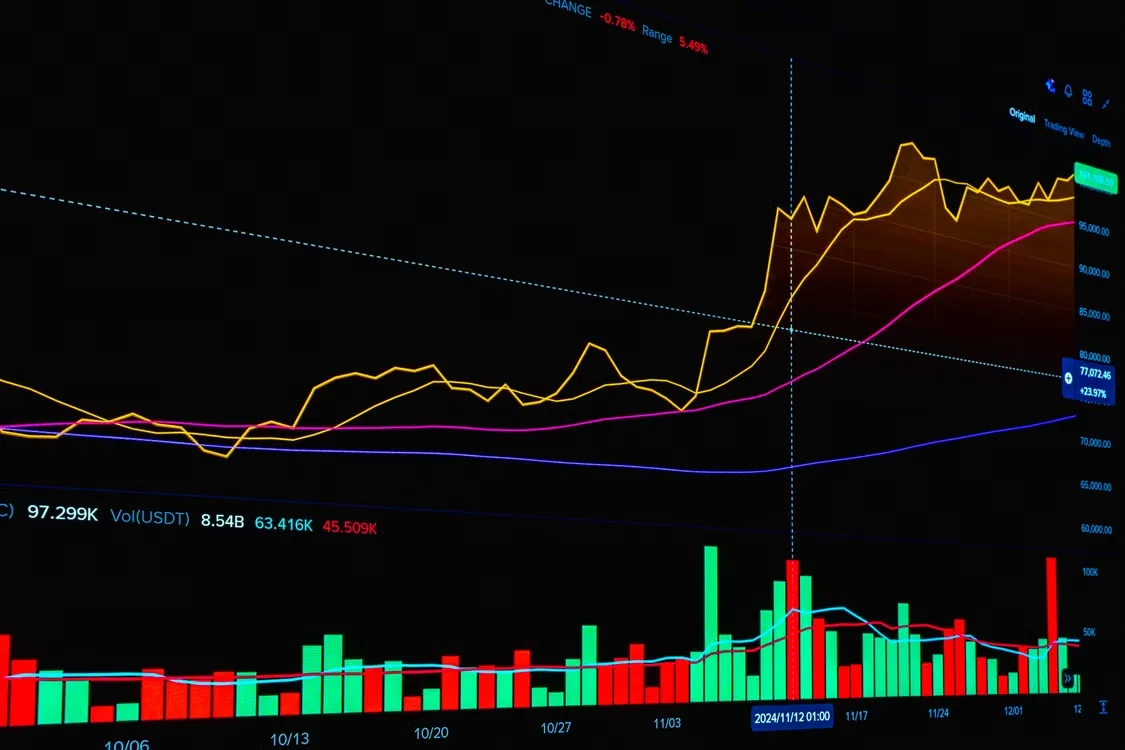
The graphic should illustrate five indicators in parallel rows, with columns for short-term observations and longer-term trends. Use neutral colors and avoid directional predictions or buy and sell signals.
For practical risk management, market participants can compare daily price changes with weekly and monthly observations. This helps identify whether a movement is isolated or part of a broader pattern.
Other factors also matter. Macroeconomic announcements, regulatory developments, geopolitical events, and changes in market participation can influence cryptocurrency prices. These influences may reinforce or weaken an existing trend.
No combination of indicators can eliminate uncertainty. Their purpose is to improve understanding of market conditions, not to establish certainty about future prices.
A Practical Framework for Evaluating Market Conditions
A structured review can make market analysis more consistent. Instead of reacting immediately to a headline, examine several indicators in sequence.
- Review price action. Compare the current price with recent daily, weekly, and monthly movements.
- Check ETF flows. Examine daily figures alongside weekly and monthly totals to identify persistent patterns.
- Assess trading volume. Determine whether participation is expanding or declining as prices move.
- Examine liquidity. Review order-book depth, bid-ask spreads, and potential execution challenges.
- Measure volatility. Consider the size and frequency of price changes across different timeframes.
- Document the context. Record relevant market events and distinguish verified data from speculation.
This framework supports more disciplined investment strategies by encouraging consistent observation rather than emotional reactions. It also provides a foundation for a broader digital asset strategy focused on preparation, transparency, and minimizing associated risks.
The Kenson Perspective
At Kenson Investments, understanding market conditions begins with examining the factors behind price movements rather than relying on a single headline. A disciplined approach to digital asset management considers market behavior, operational conditions, and the uncertainty surrounding cryptocurrency markets.
The October 14 Bitcoin rebound illustrates why this perspective matters. A price above $84,000 was a notable development, but substantial ETF outflows raised questions about the strength of demand. Neither indicator should be interpreted in isolation.
Through its educational resources, Kenson Investments encourages informed participation in cryptocurrency investment by explaining market dynamics and the risks associated with digital assets. Its approach emphasizes preparation, ongoing market awareness, and efforts to minimize exposure to avoidable risks.
Readers exploring blockchain markets can learn more about the company’s approach. The Knowledge Centre provides additional educational material, while readers can contact Kenson Investments to connect with a Digital Asset Specialist.
Looking Beyond the Headlines
Bitcoin’s price resilience may attract attention, but one day’s movement cannot confirm a lasting recovery. ETF flows, trading volume, liquidity, and volatility each reveal different aspects of market activity.
Reviewing these indicators across multiple timeframes provides a more balanced understanding of changing conditions. It also helps separate observable evidence from assumptions about what may happen next.
For anyone studying digital assets, the central lesson is straightforward: measure the broader context before drawing conclusions from a price milestone. Consistent analysis cannot remove market uncertainty, but it can support more informed decisions and a clearer understanding of the risks involved.
Disclaimer: The information provided on this page is for educational and informational purposes only and should not be construed as financial advice. Cryptocurrency assets involve inherent risks, and past performance is not indicative of future results. Always conduct thorough research and consult with a qualified financial advisor before making investment decisions.
The cryptocurrency and digital asset space is an emerging asset class that has not yet been regulated by the SEC and US Federal Government. None of the information provided by Kenson LLC should be considered as financial investment advice. Please consult your Registered Financial Advisor for guidance. Kenson LLC does not offer any products regulated by the SEC, including equities, registered securities, ETFs, stocks, bonds, or equivalents.