








Cryptocurrency markets operate around the clock, generating continuous price data across exchanges and trading platforms. This creates an opportunity to study price movements in detail, but it also introduces a measurement challenge: reported volatility can change depending on how frequently prices are sampled, whether observations are missing, and which calculation method is used.
For anyone involved in digital asset management, these differences matter. Two analyses of the same asset may report noticeably different volatility levels without either calculation containing an obvious arithmetic error. The results may simply reflect different data choices.
Reliable crypto volatility measurement therefore requires more than collecting prices and applying a formula. It requires understanding what the underlying data represents, identifying gaps, and selecting an estimator that fits the available observations.
What Crypto Volatility Measurement Actually Captures
Volatility generally describes the degree to which an asset’s price changes over a specified period. It is commonly estimated using the dispersion of price returns rather than the price level itself.
A simple approach is to calculate returns between consecutive observations and measure how widely those returns vary. However, the result depends on how the observations are defined.
For example, consider an asset whose price moves between $100 and $104 during one day. A dataset containing hourly prices may capture several intermediate rises and falls. A dataset containing only the opening and closing prices records a net increase of 4%, but it may miss substantial movement during the day.
Both datasets describe the same broad period, yet they preserve different information.
This distinction is central to crypto volatility measurement. A lower reported estimate does not necessarily mean the asset experienced fewer price fluctuations. It may mean the sampling method failed to capture them.
Sampling Frequency Can Change the Result
Sampling frequency refers to how often price observations are collected. Common intervals include one minute, five minutes, hourly, and daily observations.
Higher-frequency data provides more detail, but additional observations do not automatically produce a better estimate. Short intervals can contain more market noise, exchange-specific price differences, and temporary movements. Longer intervals smooth some of that variation but may conceal intraperiod changes.
Consider a simplified example:
- Hourly sampling: Prices move from $100 to $103, fall to $99, and finish at $102. The hourly series captures the intermediate decline and recovery.
- Daily sampling: The opening price is $100, and the closing price is $102. The daily series records a 2% net increase but does not show the path between those points.
The daily return alone cannot reveal how much the price fluctuated before the close. Consequently, an analysis based only on daily closing prices may describe a different aspect of price variability than one using hourly returns.
Comparisons also become unreliable when datasets use different intervals without accounting for the difference. Annualizing volatility, for example, requires assumptions about the return interval and the way observations relate over time. Applying the same scaling convention to incompatible datasets can create misleading comparisons.
For sound digital asset management, sampling frequency should be documented and applied consistently when comparing assets, exchanges, or periods.
Missing Prices Can Distort Volatility Estimates
Incomplete price series introduce a separate problem. Data gaps may result from exchange outages, collection failures, API limits, inconsistent timestamps, or differences in market coverage.
A missing observation is not necessarily a period of zero price movement. Treating it as one can understate volatility, while filling gaps without examining their cause can introduce artificial movements.
Imagine an asset priced at $100 at 10:00 a.m. and $110 at noon, with the 11:00 a.m. observation missing.
If the analyst calculates a two-hour return, the result is 10%. If the analyst assumes the missing price was $100, the reconstructed series records no movement in the first hour followed by a 10% increase in the second. That reconstructed path may look precise, but the intermediate price is unknown.
The actual price could have risen steadily, fallen before recovering, or moved sharply in both directions. The available observations cannot establish which path occurred.
This is why gap handling should be explicit. Analysts need to distinguish between observed prices, estimated values, and periods for which reliable data is unavailable.
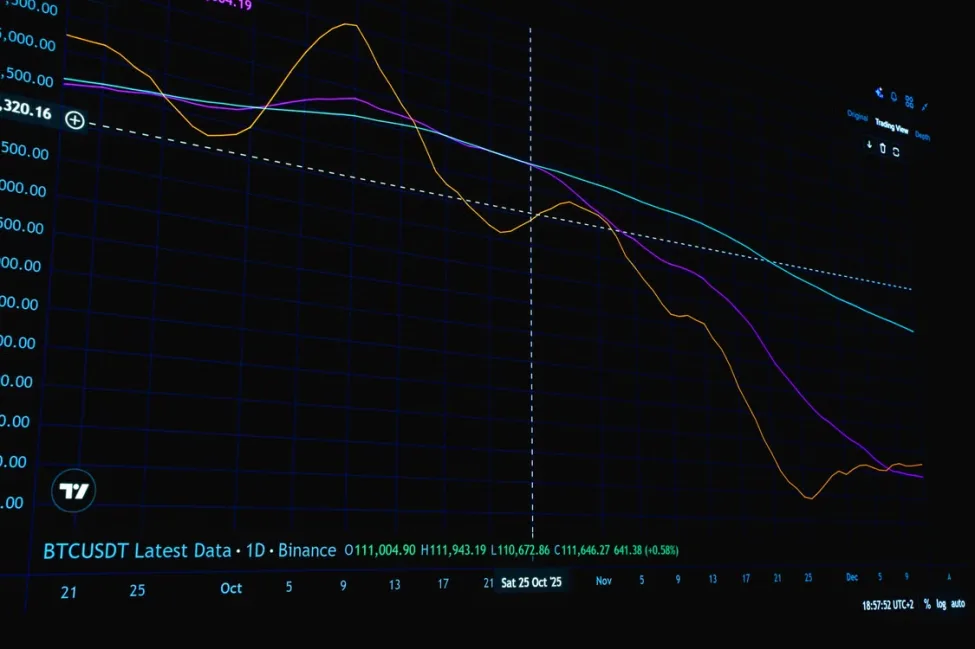
Why Gap-Filling Methods Matter
Different treatments of missing data can produce different results:
- Removing incomplete intervals: Avoids inventing prices but may reduce the number of usable observations or introduce selection bias.
- Forward-filling prices: Carries the last known price into later periods, potentially creating artificial zero returns followed by a larger return when observations resume.
- Interpolating prices: Estimates values between observations, but can smooth out real fluctuations that were never recorded.
No method is universally appropriate. The choice depends on the data source, the size and timing of the gap, and the purpose of the analysis. A long outage during a period of market stress should not be treated as equivalent to a single missing observation during otherwise stable trading.
Estimator Choice Adds Another Layer of Uncertainty
Even when two analysts use the same price series, their volatility estimates can differ because they choose different estimators.
A common method calculates the standard deviation of returns over a defined window. Another approach uses squared returns to estimate variance, while more specialized methods may incorporate intraday price ranges or account for changing volatility over time.
Each method relies on assumptions and captures particular features of the data. Standard deviation, for example, summarizes dispersion over the selected sample, but it does not explain why prices moved or establish how volatility will behave in the future.
The choice of return calculation also matters. Simple returns express price changes relative to the previous price, while logarithmic returns use the natural logarithm of the ratio between consecutive prices. These measures can produce different values, particularly for larger movements.
Before comparing estimates, analysts should check whether the calculations use the same return definition, observation interval, lookback period, missing-data policy, and annualization convention.
Without that context, a numerical comparison may imply a level of consistency that the underlying methods do not support.
The Kenson Approach: Consistency Before Comparison
At Kenson Investments, disciplined digital asset management begins with understanding the assumptions behind a reported figure rather than treating the figure as a complete account of market conditions.
Crypto volatility measurement is most useful when its methodology is transparent, and its limitations are acknowledged. A volatility estimate should be considered alongside the quality of the underlying data, the observation frequency, and the treatment of missing prices. These details help establish whether two results can reasonably be compared.
A practical review can begin with five questions:
- What is the sampling interval? Confirm whether prices are recorded every minute, hour, or day.
- How complete is the series? Identify missing timestamps, irregular intervals, and extended outages.
- How are gaps handled? Document whether observations are excluded, reconstructed, or carried forward.
- Which estimator is used? Record the return definition, calculation method, and annualization assumptions.
- Are comparisons methodologically consistent? Verify that assets and time periods are evaluated using compatible conventions.
This framework does not eliminate uncertainty or guarantee more accurate forecasts. It supports a more responsible interpretation of the evidence, helping distinguish market behavior from artifacts created by data collection and calculation choices.

Building More Reliable Volatility Analysis
Effective volatility analysis depends on recognizing that every estimate is conditional on its inputs and methodology. Sampling frequency determines which movements are visible, incomplete price histories limit what can be inferred, and estimator choice shapes how variability is summarized.
For digital asset management, the priority is not to select the method that produces the highest or lowest number. It is to use a defensible method, document its assumptions, and understand where its conclusions may be limited.
Kenson Academy and the Kenson Knowledge Center provide educational resources for readers seeking a stronger foundation in digital asset markets, market analysis, and risk awareness. Building familiarity with data quality and measurement methods can help readers assess market information more carefully and ask better questions about the conclusions drawn from it.
Disclaimer: The information provided on this page is for educational and informational purposes only and should not be construed as financial advice. Cryptocurrency assets involve inherent risks, and past performance is not indicative of future results. Always conduct thorough research and consult with a qualified financial advisor before making investment decisions.
“The cryptocurrency and digital asset space is an emerging asset class that has not yet been regulated by the SEC and the US Federal Government. None of the information provided by Kenson LLC should be considered as financial investment advice. Please consult your Registered Financial Advisor for guidance. Kenson LLC does not offer any products regulated by the SEC, including equities, registered securities, ETFs, stocks, bonds, or equivalents.”