
Dollar-Cost Averaging Calculator
- Real historical data
- No forecasts or predictions
- Fees & slippage not included
Set up your hypothetical contribution
Bitcoin is the original digital asset. Historical data availability varies by asset — the date pickers below will adjust automatically.
Example: $100/month, +$25 every 12 months — month 1–12 contributes $100, month 13–24 contributes $125, and so on.
Edit any month's contribution individually — invest more in some months, less (or nothing) in others. Amounts default to your Fixed monthly value and regenerate when you change the date range.
Illustrative only — not a forecast or expected return of any real asset.
What this contribution would have done
- Each month's purchase uses the first available market price on or after the 1st of that month (UTC), pulled from CoinGecko.
- Fees, spreads, taxes, and slippage are not included — real-world results would be lower.
- "Total return" is the simple percentage gain/loss on total contributed, not annualized.
| Month▲ | Price▲ | Contribution▲ | Units bought▲ | Cumulative units▲ | Total invested▲ | Value at that point▲ |
|---|
Your results are readyEnter your details to view your full results — total contributed, units accumulated, value, return, and the complete month-by-month breakdown.
By submitting, you agree to be contacted by Kenson Investments about this request. See our Privacy Policy.
Want guidance on how this applies to you?
Request a free consultation and a member of our education team will walk through what this pattern could mean for your own situation — no pressure, no sales pitch.
By submitting, you agree to be contacted by Kenson Investments about this request. See our Privacy Policy.
Compliance disclaimer. This tool contains zero financial advice, zero return promises, and zero investment solicitation.
- Real historical data mode uses actual past market prices from a public third-party API (CoinGecko) — real, but historical, not predictive. We do not forecast future prices. If that data can't be retrieved, this tool shows an error rather than silently substituting synthetic numbers. On CoinGecko's free tier, real historical data only covers the past 365 days; older start dates require Illustrative mode.
- Illustrative model mode uses entirely simplified, synthetic prices to demonstrate DCA mechanics — not real market data, and not a forecast or expected return.
- Fees, spreads, taxes, and slippage are not included in any calculation.
- Past performance is not indicative of future results. Digital assets carry significant risk of loss. Kenson Investments is not a registered investment adviser.
What Is A Crypto DCA
Calculator?
A crypto DCA calculator shows what a regular contribution schedule would have been worth over a past period.
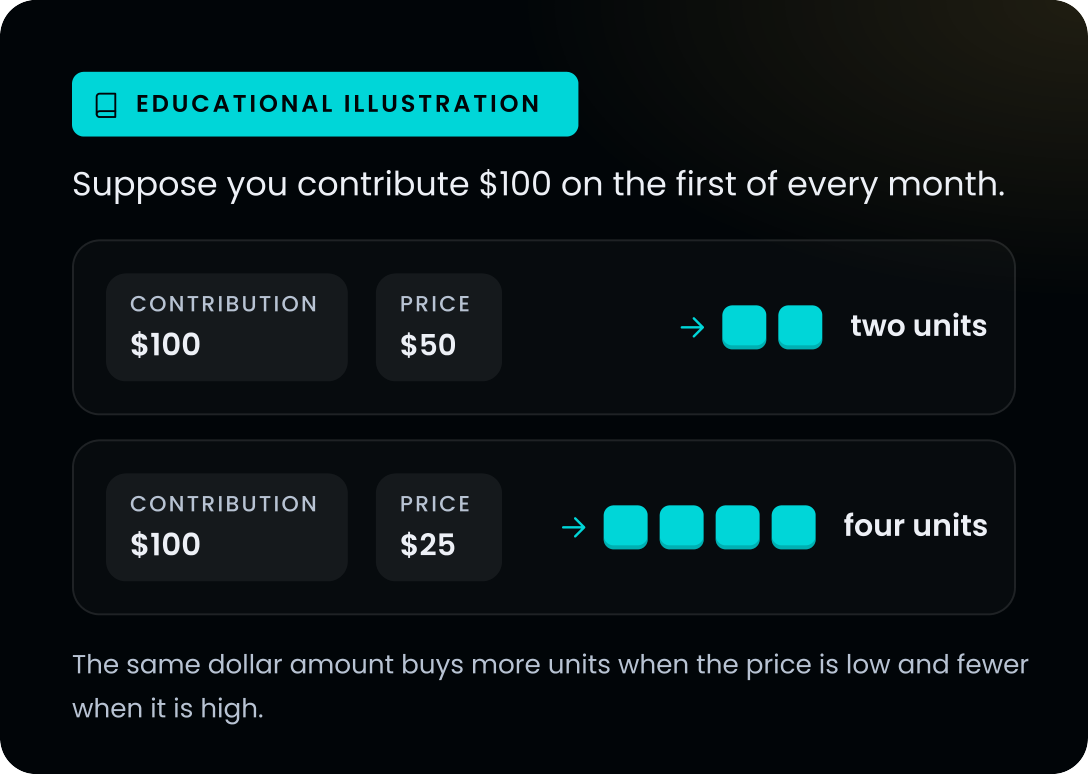
Dollar-cost averaging, or DCA, means putting a set amount into an asset at regular intervals, whatever the price is that day. The same dollar amount buys more units when the price is low and fewer when it is high.
Our dollar-cost averaging calculator applies that idea to real historical market prices. You can see how the mechanics played out for Bitcoin, Ethereum and eight other digital assets, month by month. It is an educational tool. It does not forecast prices, and it does not tell you what to buy.
How Dollar-Cost Averaging Works
Suppose you contribute $100 on the first of every month. In a month when the asset trades at $50, you receive two units. In a month when it trades at $25, you receive four. Because the same dollar amount buys more units at lower prices and fewer at higher prices, your average cost per unit can end up below the simple average of the prices over the period.
DCA does not remove risk. If an asset falls and stays down, a DCA schedule loses money too. What it changes is timing risk. You are no longer relying on one entry price, so a single badly timed purchase matters less.
How To Use The Dollar-Cost
Averaging Calculator

Choose an asset.
Bitcoin, Ethereum, Chainlink, Litecoin, Solana, Cardano, Polkadot, Avalanche, XRP or Uniswap.

Add an initial investment.
This is optional and defaults to $0.

Set the date range.
Pick a start month and an end month.
Pick a contribution pattern.
Fixed every month, stepped up over time, or a custom amount for each month.

Choose the price source.
Real historical data, or an illustrative model with stable, volatile or growth patterns.

Run the calculation.
Enter your details once to view the full results.
What The Results Show
The calculator returns six headline figures: total contributed, units accumulated, value at the end of the period, total return, average cost per unit, and profit or loss.
Below those, an interactive chart plots portfolio value, total contributed and the asset price on one timeline. Hover over any month to see what was bought and what it was worth at that point. A sortable month-by-month table lists every purchase and tags the cheapest and priciest months, which makes it easy to see where the averaging effect came from.

Total contributed

Units accumulated

Value at the end of the period

Total return

Average cost per unit

Profit or loss


DCA Vs. Lump Sum: What The
Calculator Can Teach
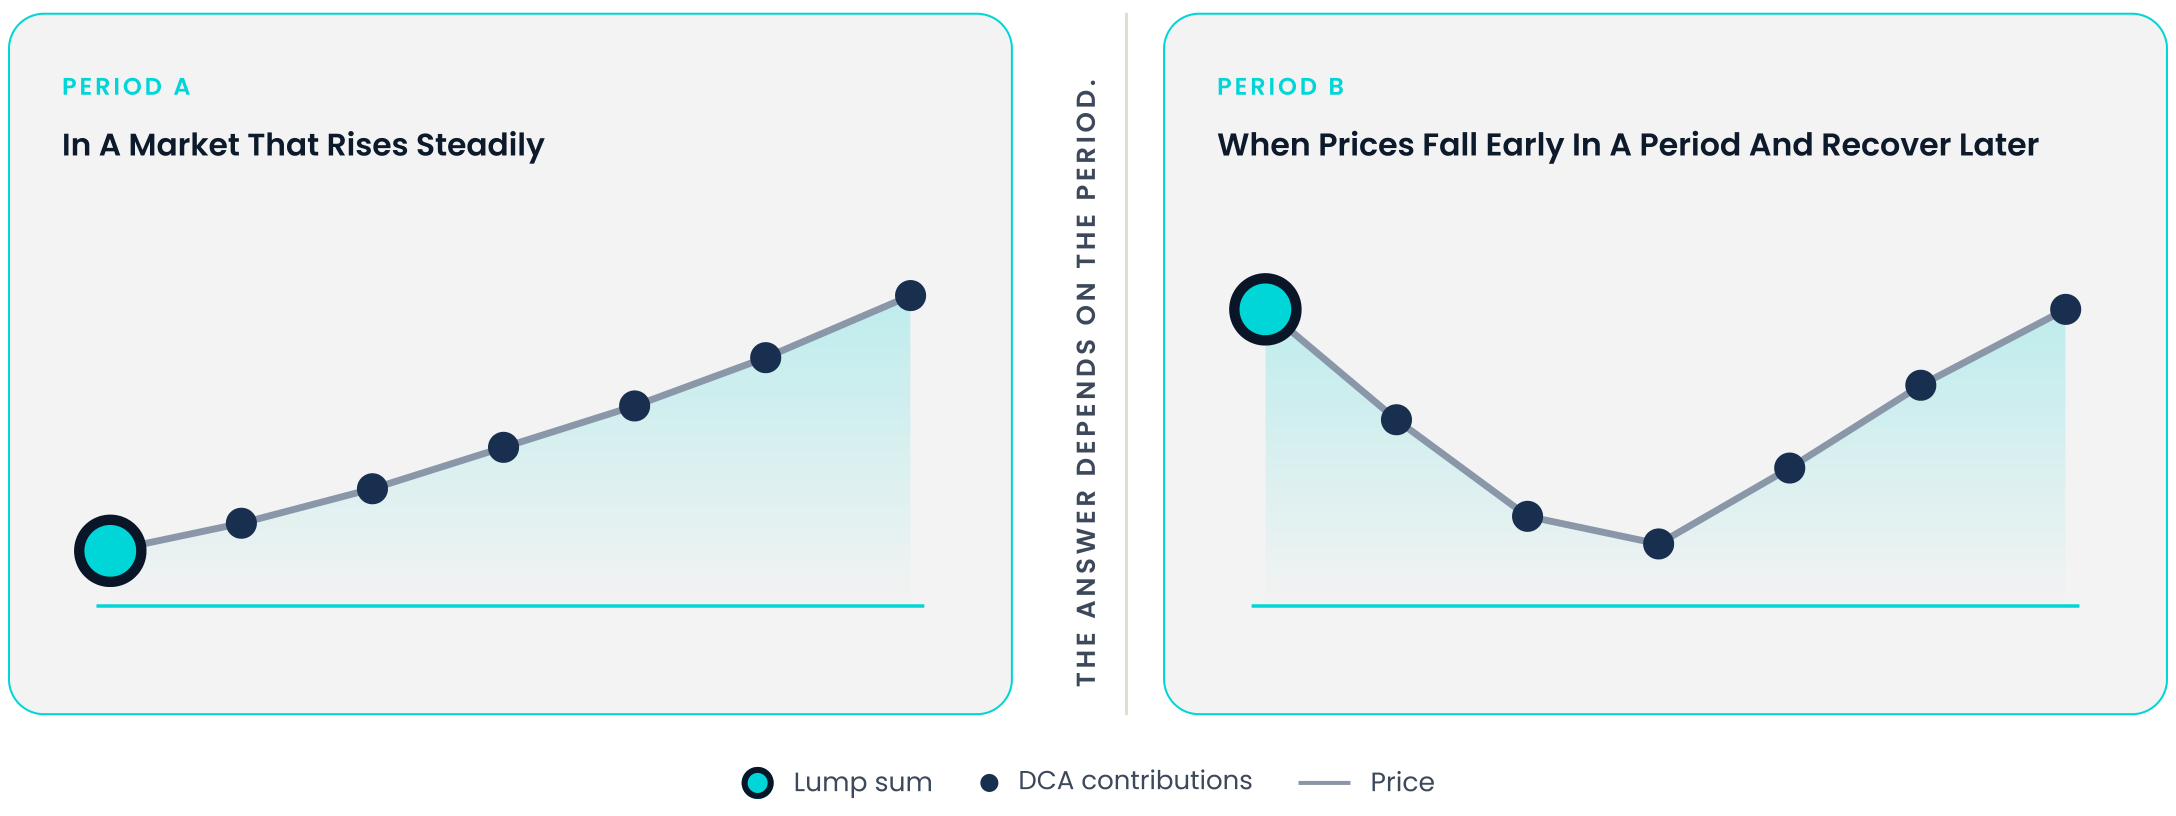
A common question is whether dollar-cost averaging beats investing a lump sum. The answer depends on the period. In a market that rises steadily, a lump sum placed at the start ends higher, because all of the money was exposed for the whole period. When prices fall early in a period and recover later, DCA contributions made along the way buy at lower prices, which can materially change the ending result.

You can test this yourself. Run the calculator once with an initial investment and no monthly contribution. Then run it again with the same total spread across monthly contributions. Comparing the two results for the same asset and dates shows how much the outcome depended on timing.
What This Bitcoin DCA
Calculator Leaves Out
No calculator captures everything, and this one is clear about its limits.

Fees and taxes.
Trading fees, spreads, slippage and taxes are not included. Real-world results would be lower.

Data window.
Real historical data covers the most recent 12 months. For longer periods, use the illustrative model, which is synthetic and not a record of any real asset.

Return type.
Total return is a simple percentage of what you contributed. It is not annualized.

The future.
Past prices describe what happened. They are not a guide to what happens next.

Educational Use Only. The information and examples on this page are provided to help explain digital asset concepts and historical scenarios. They are not personalized financial guidance or a recommendation to buy, sell or hold any asset.
Keep learning with Kenson’s other tools
If you want to test a mix of assets instead of one, try the Digital Asset Scenario Tool. To understand how you might react to the swings a DCA chart reveals, take the Crypto Risk Profile Quiz. You can also sketch a hypothetical split across asset categories with the Portfolio Allocation Visualizer.



Frequently Asked Questions
What is dollar-cost averaging in crypto?
Dollar-cost averaging is contributing a fixed amount to a digital asset on a regular schedule, regardless of price. It spreads your purchases across many price points instead of one.
Is the crypto DCA calculator free?
Yes. The calculator is free to use. You enter your details once to view the full results.
Which assets does the calculator support?
Bitcoin, Ethereum, Chainlink, Litecoin, Solana, Cardano, Polkadot, Avalanche, XRP and Uniswap.
Does the calculator use real prices?
In Real historical data mode, yes. It uses actual past market prices from a public third-party API (CoinGecko) covering the past 365 days. Illustrative model mode uses simplified, synthetic prices and is not real market data.
Does the DCA calculator include fees?
No. Trading fees, spreads, slippage and taxes are not included in any calculation, so real-world results would be lower.
Is DCA better than investing a lump sum?
It depends on the period. In a market that rises steadily, a lump sum placed at the start ends higher. When prices fall early and recover later, DCA contributions made along the way buy at lower prices.
Can the calculator predict future returns?
No. Past prices describe what happened. They are not a guide to what happens next, and the calculator does not forecast future prices.

Compliance Disclaimer.
This tool and the content on this page are for educational purposes only. They do not constitute financial advice, investment guidance, or a recommendation to buy, sell, or hold any digital asset.
Real historical data mode uses actual past market prices from a public third-party API (CoinGecko). The prices are real but historical, not predictive. We do not forecast future prices. If that data can’t be retrieved, this tool shows an error and does not substitute synthetic numbers. Real historical data covers the past 365 days; older start dates require Illustrative mode.
Illustrative model mode uses entirely simplified, synthetic prices to demonstrate DCA mechanics. It is not real market data and not a forecast or expected return.
Results are hypothetical, were calculated with the benefit of hindsight, and do not represent actual trading or any actual account.
Fees, spreads, taxes, and slippage are not included in any calculation.
Past performance is not indicative of future results. Digital assets carry significant risk of loss. Kenson Investments is not a registered investment adviser.