







Charting Your Course: How to Validate Digital Asset Chart Signals
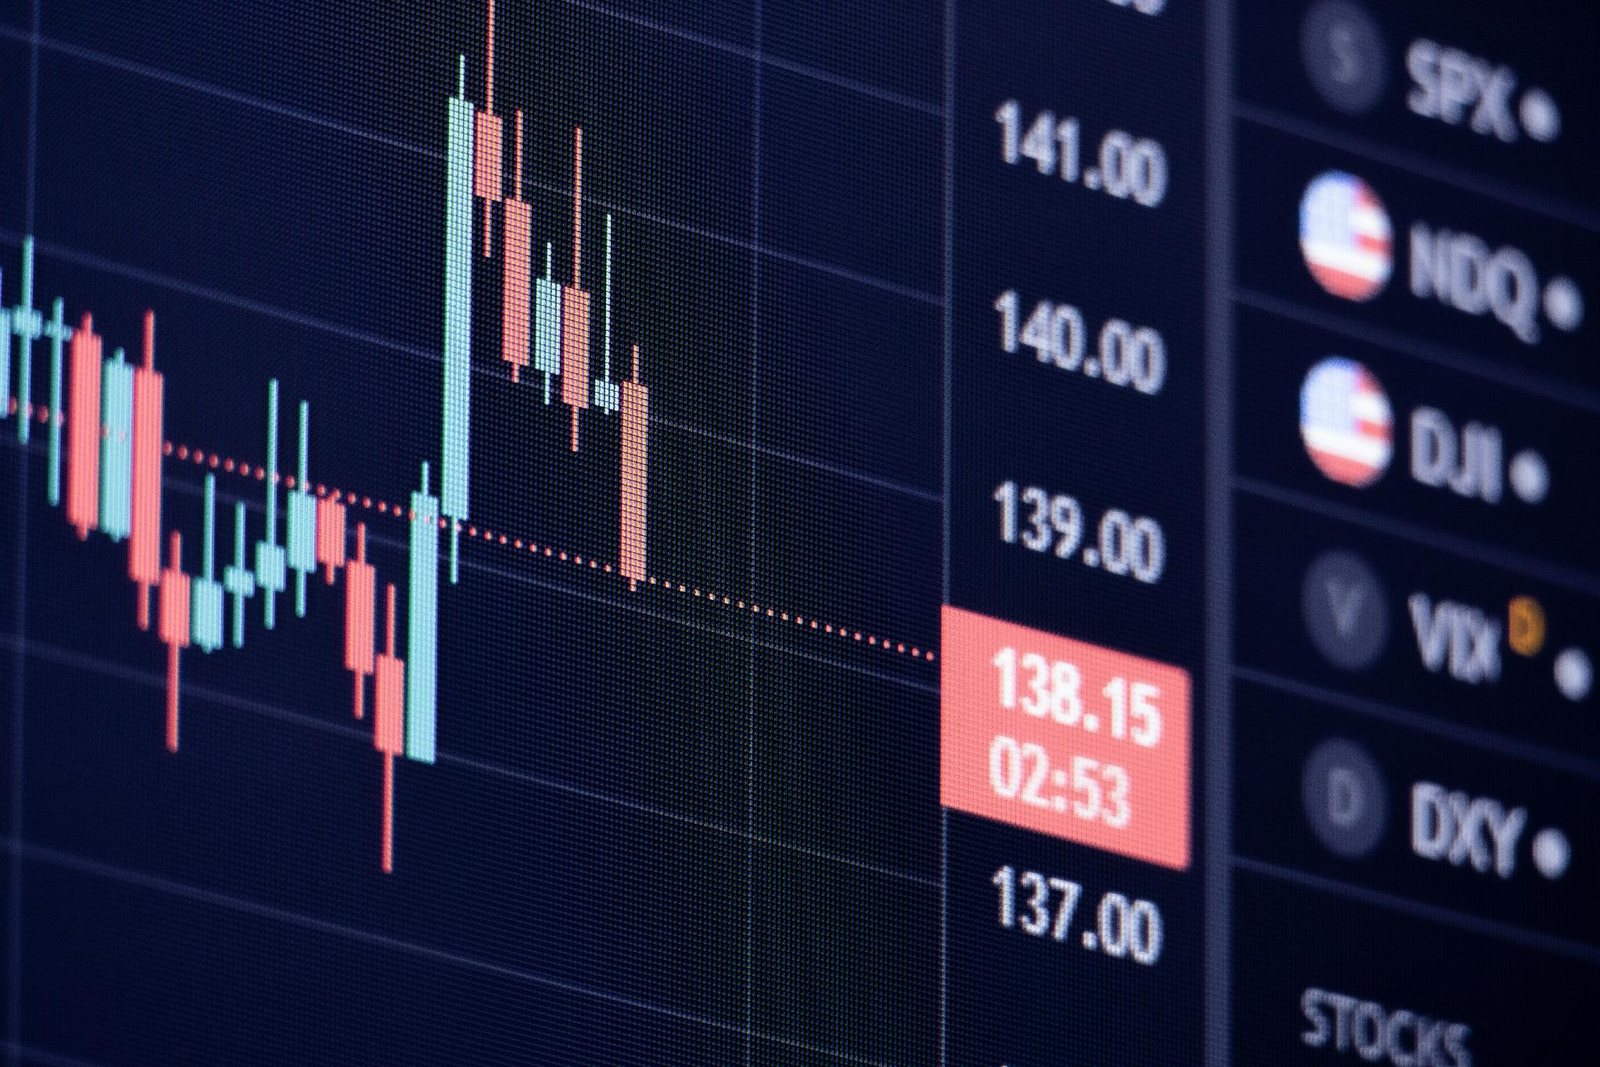
A digital asset chart appears to break above a long-observed price level. The latest candle shows a higher price, and a momentum indicator is elevated. Before treating this as a confirmed breakout, an analyst needs answers: Has the candle closed? Which instrument supplied the price? Would the result survive a check of the underlying observations? A picture of a chart cannot settle those questions.
Technical analysis is useful for describing price behavior, but a chart signal is still a claim based on a chosen data series and set of rules. This article provides a practical process for checking that claim and recording whether it warrants further review. It does not offer a trading strategy or evidence that any pattern predicts a profitable outcome. Kenson’s guide to market-analysis tools covers the wider indicator landscape; the focus here is validation.
What the chart is actually measuring
An OHLCV candle summarizes the open, high, low, close and reported traded volume within a specified interval. Its meaning depends on the trading pair, quote currency, venue, instrument type and timestamp convention. The close of a four-hour spot candle, for example, is not interchangeable with a perpetual-futures mark price or the value of a composite index. Nor is a displayed historical price necessarily an executable quote: available bids, offers and depth can differ.
Data completeness matters. Coinbase Exchange’s candle documentation states that historical rates may be incomplete and that intervals without trades may be omitted. Its documented endpoint offers specified candle intervals, not a native four-hour interval; a four-hour series based on those inputs would require an identified aggregation method. Kraken’s OHLC documentation explicitly says its latest returned observation represents the current, unfinished timeframe. These are examples of provider-specific behavior, not universal rules for every exchange.
The reviewer should establish whether a charting interface excludes missing periods, fills them, blends venue data or displays the latest still-forming bar. Compare timestamps in a consistent time zone, record the feed version where practical, and check for stale updates after outages. For an institution, such checks belong in a defined evidence process, not an assumption that a polished chart is complete.

What moving averages, RSI and price levels can establish
Free educational tool
How healthy is your hypothetical portfolio?
Seven questions about how a hypothetical portfolio is structured, with three sub-scores and an overall Health Score out of 100.
Educational tool. Results are not investment advice.
A simple moving average gives equal weight to prices over its lookback; an exponential moving average gives greater weight to recent observations. Both use historical inputs. TradingView’s moving-average documentation describes them as lagging, reactive indicators. An average crossing another average records a relationship between two historical series. It does not, by itself, establish future direction, adequate liquidity or a profitable entry.
Relative strength index (RSI) measures the balance of recent positive and negative price changes on a zero-to-100 scale. Common readings above 70 and below 30 are often described as overbought and oversold. Those conventions are explained in TradingView’s RSI reference, but they do not mean an immediate reversal must follow. A strong trend can maintain an elevated RSI. Changing the lookback or candle series also changes the calculation.
Prior support and resistance should be treated as observed price areas, not exact barriers. A line through earlier highs can establish a review level, but the analyst must specify how that area was selected and what constitutes a break. A more elaborate charting method, such as Fibonacci retracement analysis, belongs in its specialist discussion, not as an extra unexplained confirmation here.
| Observation | Reasonable interpretation | Not established |
|---|---|---|
| Price over a 20-period SMA | The price is above its mean for that chosen series. | That the price will continue rising. |
| RSI reads 72 | Recent gains outweigh losses under the chosen setting. | That the asset must immediately decline. |
| Price exceeds prior resistance intrabar | The price traded beyond an identified area temporarily. | That a candle-close breakout rule has passed. |
| Reported volume is unusually high | The provider reports elevated turnover. | That independent investors supplied genuine demand. |
A seven-stage chart-signal validation process
1. Identify the market. Record the asset, pair, quote currency, spot or derivative status, venue, feed and observation time. A chart labeled only with a token ticker is insufficient. A wrapped representation or futures contract may have different trading conditions from the spot asset. Keep the original instrument identifier in the review record.
2. Inspect candle integrity. Confirm chronological order, interval boundaries, missing observations and the completion status of the latest bar. A gap may represent no trading or a data problem; the distinction cannot be assumed. A still-forming candle must not be used as though it were a historical close. Preserve the source and any transformations applied to the data.
3. Freeze the analytical rule. Specify the price area, selected timeframe, indicator type, lookback and exact confirmation condition before examining the outcome. For example, “a completed four-hour close strictly above $100” is testable; “a convincing breakout” is not. Record whether the level was identified before the test or selected after the move.
4. Interpret only the observation. Describe what the defined indicator actually shows. A moving average may support an account of recent trend; RSI may describe momentum; a price excursion may test a prior high. None establishes a probability of gain unless a separate, defensible study supports that inference. Correlated price indicators are not independent proof merely because both appear on one screen.
5. Seek comparable corroboration. Check another suitable source or venue where the same instrument and economically equivalent quote can be compared. Do not contrast a perpetual-futures mark with a spot trade without explaining the difference. Also determine whether two chart vendors are relaying the same exchange feed. Corroboration that shares the original data source is weaker than it appears.
6. Document failure conditions. A close below the defined level, stale feed, sharp spread expansion or conflicting comparable venue observation may invalidate or weaken a particular interpretation. Thin order books can produce dramatic prints that are difficult to transact against. Detailed price discovery in low-liquidity markets and digital asset trade execution considerations require separate investigation; this stage only establishes that chart validation cannot substitute for them.
Free educational tool
Are you ready for digital assets?
Seven quick questions on knowledge, mindset and goals, with one honest answer about where you stand.
Educational tool. Results are not investment advice.
7. Record an outcome. Mark the observation as “validated for further review,” “insufficient evidence,” or “invalidated” according to the predefined rule and available evidence. Include source, timestamp, inputs, caveats and reviewer. Validation means the particular observed condition survived its checks, not that a buy or sell order has been approved. Institutional pre-trade risk controls remain a different authorization step.
Worked example: a four-hour breakout that did not confirm
Consider Meridian Token (MRT), a fictional spot asset quoted in US dollars on an illustrative venue. Every value in this example is hypothetical, not drawn from a live exchange. The review concerns a hypothetical four-hour interval from 08:00 to 12:00 UTC on October 1, 2026. Before the interval begins, the analyst identifies a prior resistance area around $100 and sets one confirmation rule: the completed candle must close strictly above $100. A real review would additionally preserve the exchange feed, retrieval time and any method used to aggregate four-hour candles.
During the unfinished interval, the fictional token briefly trades at $103. An illustrative RSI reading is assumed to be 72 at that point; no underlying closing-price series has been supplied to calculate it. A screenshot circulated before the candle closes could suggest a breakout. The completed four-hour candle instead closes at $99. The temporary excursion above $100 therefore does not satisfy the predefined closing-price rule. Recalculating RSI after the final close might produce a different value; neither reading independently establishes future price direction.
| Review item | Initial observation | Verification finding | Consequence |
|---|---|---|---|
| Market / interval | Fictional MRT spot, four-hour | Timeframe and aggregation must be recorded. | No claim about a real exchange. |
| Resistance test | $100 area, intrabar trade at $103 | Completed candle closes at $99. | Close-based confirmation fails. |
| RSI | Assumed intrabar RSI of 72 | Underlying lookback series unavailable. | No final RSI calculation claimed. |
| Moving average | 20-period SMA selected as context | Prior 20 closes not supplied. | No SMA or crossover conclusion. |
| Volume / venues | No independent readings supplied | Corroboration not established. | Evidence gap remains. |
| Decision | Close strictly above $100 required | Rule not met at close. | INVALIDATED under this rule. |
The conclusion is narrow: this particular breakout signal was invalidated under a specified close-based rule. It does not follow that MRT must fall, that an elevated RSI recommends selling, or that any alternative setup would fail. In another case, a candle might close above resistance but receive an “insufficient evidence” outcome because the venue data is stale or the instrument cannot be identified confidently.
Why seemingly persuasive signals still fail
Incomplete candles and mismatched timestamps are obvious problems, but errors can be subtler. One venue may show a sharp print while another comparable market does not; a chart may use a derivative index while its reader assumes executed spot prices. Reported volume can rise because of concentrated, incentive-driven or otherwise unrepresentative activity. The analyst should record conflicts rather than automatically choosing the version that supports the preferred narrative.
Lagging indicators can also disagree with one another, especially when they operate on different timeframes. A rising short moving average may coexist with weak longer-term performance. An RSI threshold may persist during a trend. The fact that both indicators derive substantially from the same closing prices limits how much independent corroboration they provide. Readers seeking explanations of broader price drivers can consult Kenson’s market movements analysis.
Historical tests create a further trap. Selecting the resistance level, indicators and observation window after the outcome can make a pattern look unusually consistent. Backtests may omit trading fees, spread, slippage and failed or partial executions. The SEC staff’s Investor Bulletin on performance claims cautions that backtested outcomes are hypothetical and that historical performance does not predict future results. This warning concerns the interpretation of performance claims; it does not make a specific digital asset chart method unlawful.
Market quality is not purely a chart issue. IOSCO’s crypto and digital asset market recommendations, summarized by the Financial Stability Board, identify market manipulation, conflicts and operational risks among regulatory concerns. These are system-level risk categories, not evidence that any particular candle has been manipulated. For institutions, verified market-data controls and digital asset operational risk reviews sit alongside, but do not replace, the narrower chart-checking process.
Free educational tool
Test a hypothetical allocation against history
Choose assets and weights, set contributions and costs, and review historical outcomes, volatility and drawdowns. Historical data, not a forecast.
Educational tool. Results are not investment advice.
A practical chart-review record
A useful record is concise enough to reproduce. It should answer: Which exact asset and venue were reviewed? Was the chart spot, derivative or index based? What time zone and candle interval were used? Were all necessary periods available and complete? What moving-average and RSI settings applied? Was the confirmation rule defined in advance? Did a completed candle pass it? Were corroborating sources genuinely comparable? Which conditions or missing inputs limited the judgment? What finding was recorded, and by whom?
For the fictional MRT review, the record would read: “MRT/USD spot; illustrative venue; October 1, 2026, 08:00–12:00 UTC; prior resistance area $100; rule requires a completed close strictly above $100; intrabar trade $103; completed close $99; intrabar RSI 72 assumed, not calculated; no independent volume or venue comparison; breakout invalidated under the close-based rule.” In a real review, the record would also attach source observations, the data-retrieval time and any candle-aggregation method. The fictional finding does not recommend opening a trade.
An institutional review log can also assign ownership for unresolved questions and specify when fresh data is needed. This is a matter of digital asset internal controls, not an assertion that a second reviewer or more indicators will make a weak signal profitable. If documentation is inadequate, “insufficient evidence” is a valid conclusion. No analytical procedure can convert an incomplete market observation into guaranteed market foresight.
Make charts accountable to their evidence
Digital asset charts can help structure observations about price and momentum. Their usefulness improves when the reviewer can identify the actual market, reproduce the calculations, distinguish incomplete from completed observations and state the limits of the finding. Chart validation should precede further analysis, not be confused with investment suitability or order authorization. To learn more about Kenson Investments’ market research and educational resources, contact the Kenson team.
Disclaimer: The information provided on this page is for educational and informational purposes only and should not be construed as financial advice. Digital assets involve significant risk, including the possible loss of principal, and past performance is not indicative of future results. Always conduct thorough research and consult a qualified financial advisor before making investment decisions.
Digital asset regulation in the United States is still developing. Some areas, such as payment stablecoins, now have a federal framework, but comprehensive market-structure legislation has not yet been enacted. None of the information provided by Kenson LLC should be considered financial investment advice. Please consult your Registered Financial Advisor for guidance. Kenson LLC does not offer any products regulated by the SEC, including equities, registered securities, ETFs, stocks, bonds, or equivalents.